- Sign In
- |
- Sign Up
- |
- My Quote (0)
- |
- CART (0)
View, review and print results captured by your compatible Hioki power logger on your PC with this software. The software can provide trend graph displays.
View, review and print results captured by your compatible Hioki power logger on your PC with this software. The software can provide trend graph displays.
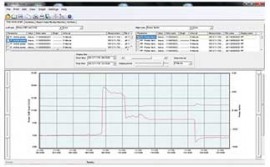
Install this Hioki SF1001 Power Logger Viewer Software on your PC to view trend graphs of the data captured by your Hioki PW3360/3365 series or 3169 clamp-on power logger device. The software also provides summary, daily, weekly and monthly reports.
Features
| Compatibility | Hioki PW3360/3365 series, 3169 series power loggers |
| Operating System | Windows 8.1, 8, 7 (SP1 or later), Vista (SP2 or later, 32-bit), XP (SP3 or later, 32-bit) |
| Display Item | Voltage, current, active power, reactive power, apparent power, power factor, frequency, integrated active power, integrated reactive power, demand volume, demand value, voltage disequilibrium factor, pulse, harmonics (level, content, phase angle, total value, THD), stacked bar graph displaying up to 16 types of data, cursor measurements |
| Summary Display Function | Daily, weekly and monthly report displays, load factor calculation, time span aggregation |
| Waveform Display | Displays waveform data at specified data |
| Harmonic Display | List, graph, cursor calculation |
| Print Function | Preview, print, comment entry, header/footer settings, printing support |
| Report Printing | Print (static) contents over a specific time period; output contents: standard or selected output items; available output items: trend graph, summary, daily report, harmonic list, harmonic graph, waveform; report creation method: standard print; report output settings: save/load report output settings |
| Copy Function | Captures any display image to the clipboard |